Cassandra Web Interface
7 minuti di lettura
August 22, 2025Indice dei contenuti
This document provides a comprehensive guide to operating the Cassandra system via its web interface.
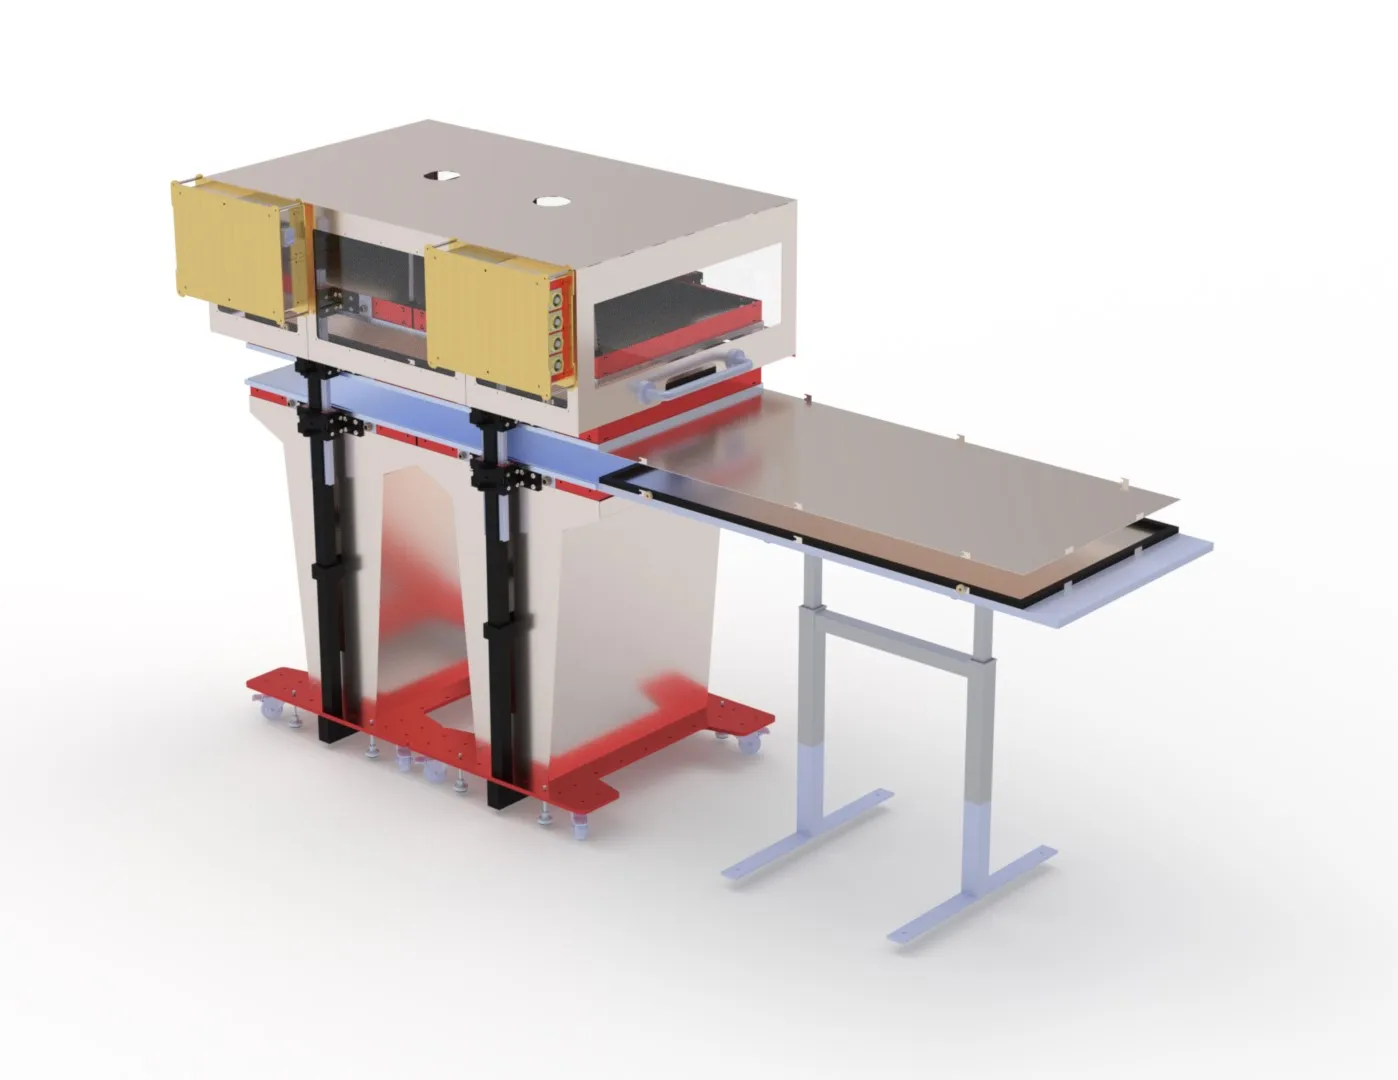
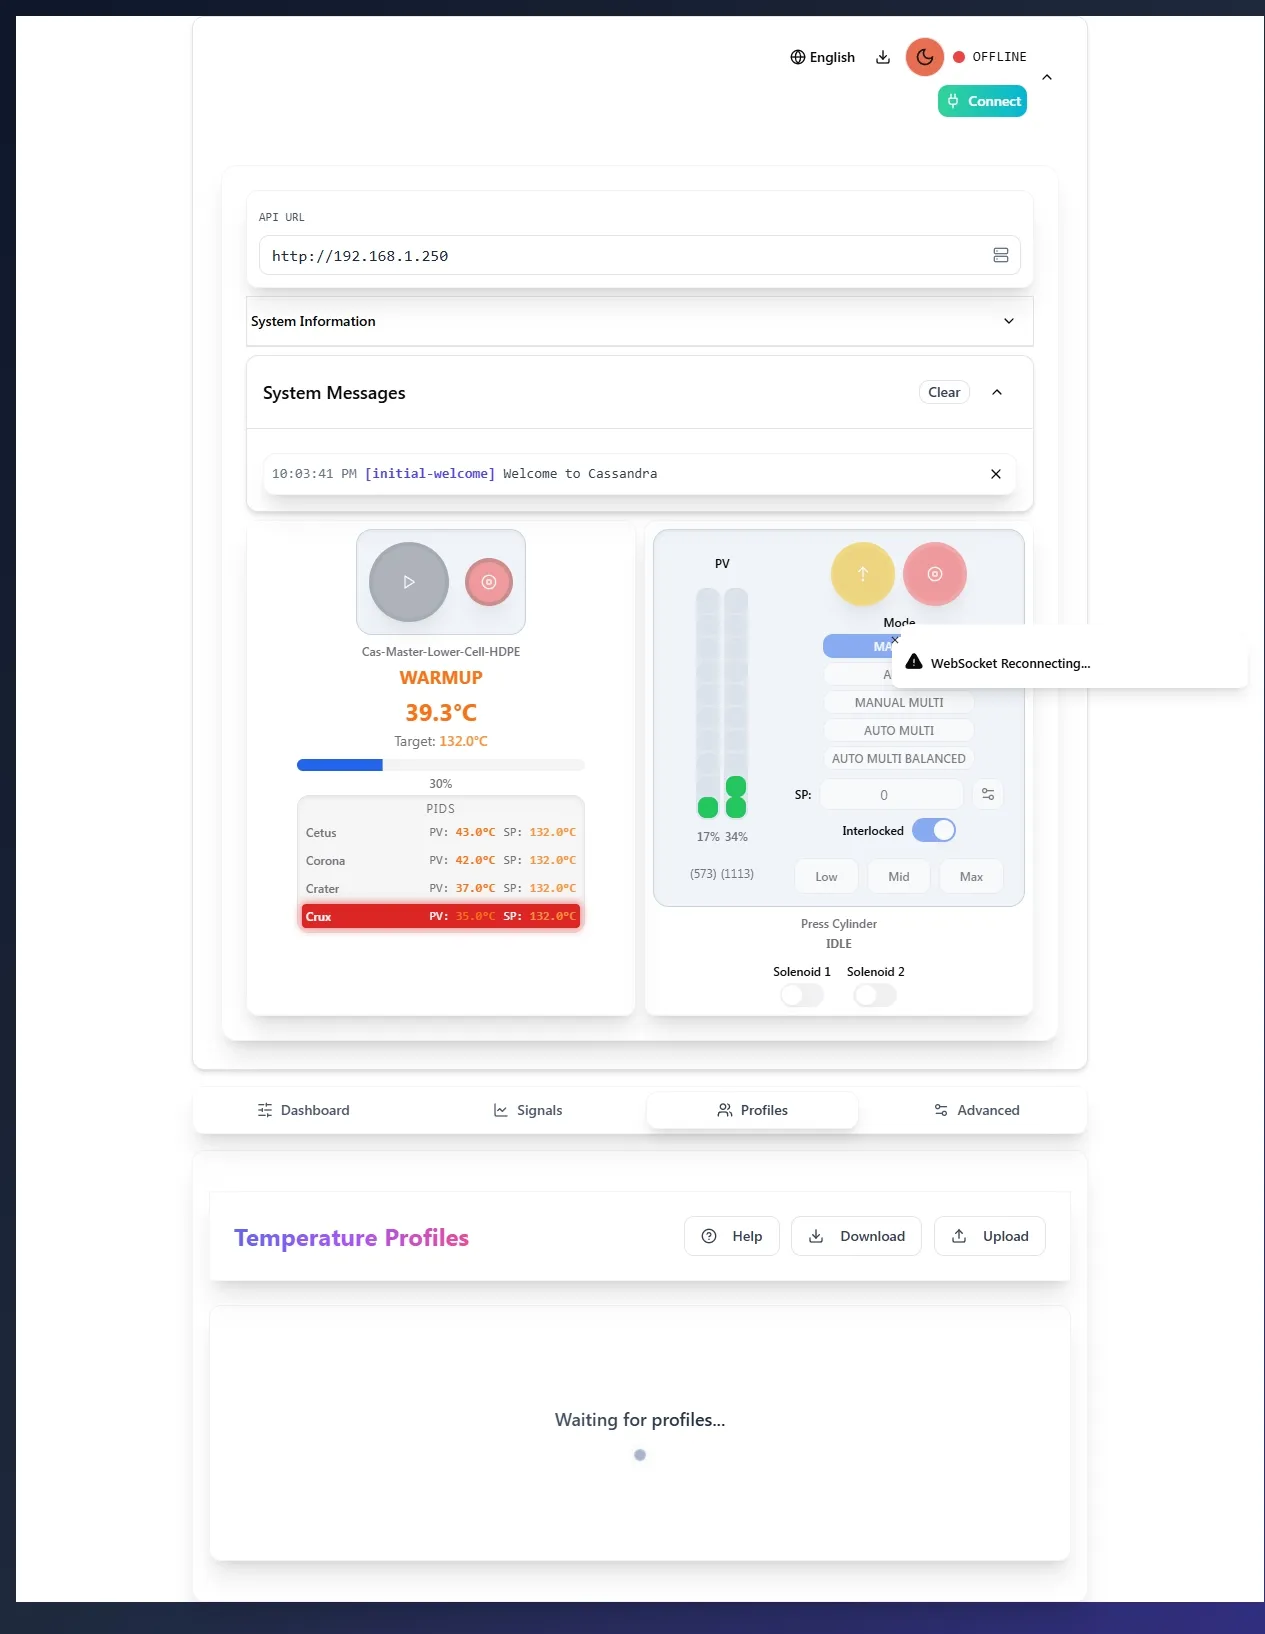
1. Dashboard
The main dashboard provides an overview of the system status and quick access to controls. It is divided into several key areas:
Active Temperature Profiles
This section displays the currently running and paused temperature profiles. You can monitor the progress of each profile, including elapsed time and total duration. Controls are available to pause, resume, or stop profiles.
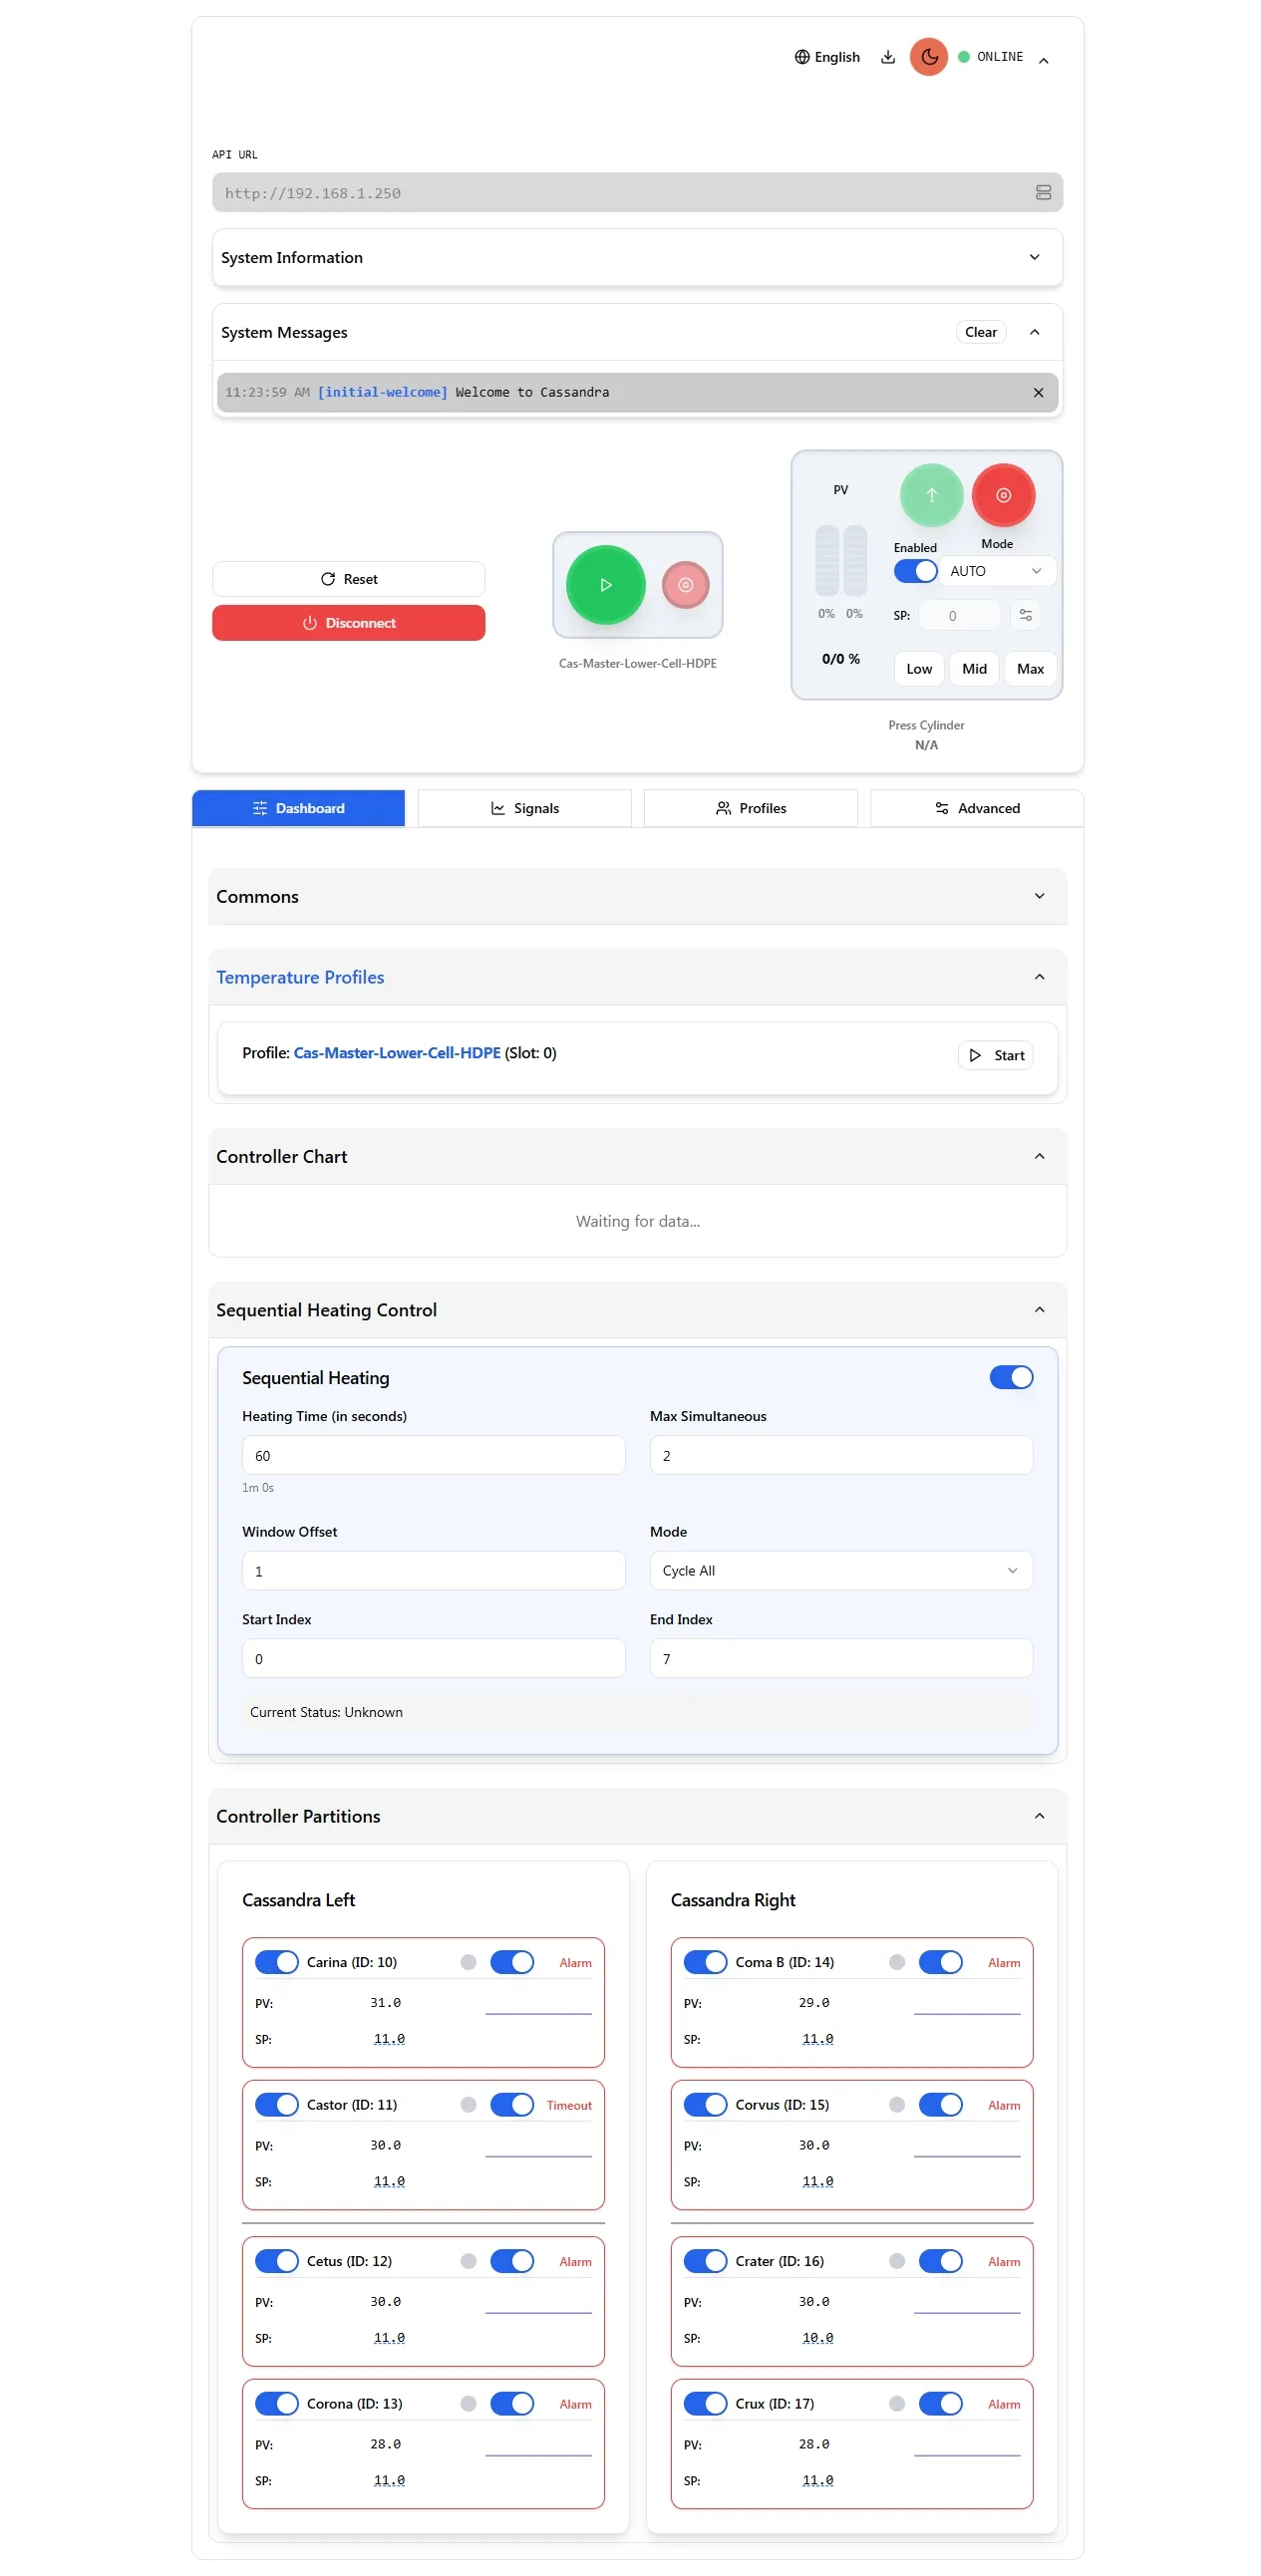
Sequential Heating
The Sequential Heating Control panel allows you to configure how multiple heating zones or elements are activated in a sequence, rather than all at once. This can be useful for managing power consumption or for processes that require a specific order of heating operations.
The panel includes the following settings:
-
ON/OFF Toggle: A main switch located at the top right of the panel to enable or disable the sequential heating feature.
-
Min Heating Time (1-60s): Minimum duration a heater must stay active once started to prevent rapid cycling. Range: 1-60 seconds.
-
Max Heating Time (1s-2h): Maximum duration a heater can stay active during initial heatup phase. Range: 1 second to 2 hours.
-
Max Oscillating Time (1s-1h): Maximum duration a heater can stay active after reaching setpoint (post-heatup oscillation). Range: 1 second to 1 hour.
-
Max Simultaneous: Maximum number of heating elements that can be active at the same time during the sequence (e.g.,
1). -
Window Offset: Step size (number of elements) by which the active heating window advances when the sequence progresses. For instance, an offset of
1moves to the next element in the defined range. -
Start Index: Starting point or the first element in the heating sequence (e.g.,
0). -
End Index: Ending point or the last element in the heating sequence (e.g.,
7). -
Mode: Selects the sequential heating algorithm:
- 0 - All: Cycles through all devices with time-based control. Advances window after max heating time or when device stops heating.
- 1 - SP: Cycles through devices in groups, advancing only when all devices in current window reach their setpoint minus deadband.
- 2 - SP Any: Heats any devices that need heating up to the max simultaneous limit, without strict cycling order.
-
Post-Heatup Mode: Mode to switch to after initial heatup phase is complete (same options as Mode).
-
Current Status: Display field showing the current operational state of the sequential heating process (e.g.,
Current Status: Idle).
Mode Details
All Mode (0): Traditional time-based cycling that moves through devices in a sliding window. Each device heats for the specified duration or until it stops needing heat, then the window advances by the offset amount.
SP Mode (1): Setpoint-aware cycling that waits for all devices in the current window to reach their target temperature before advancing. More efficient for synchronized heating.
SP Any Mode (2): Flexible heating that activates any devices needing heat up to the simultaneous limit, without maintaining strict cycling order. Best for mixed heating requirements.
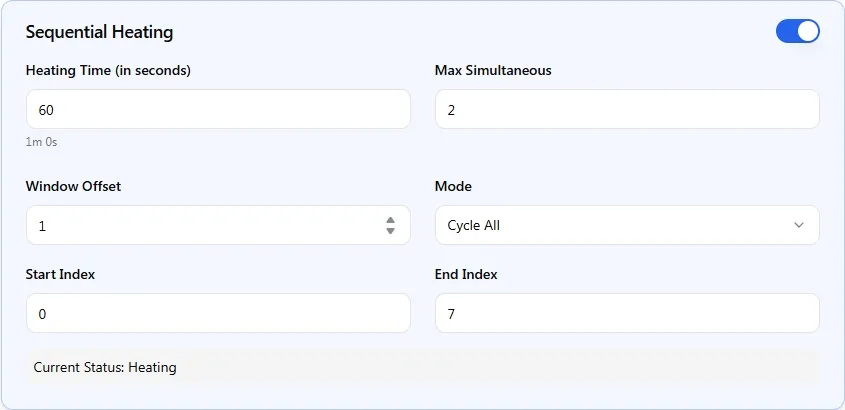
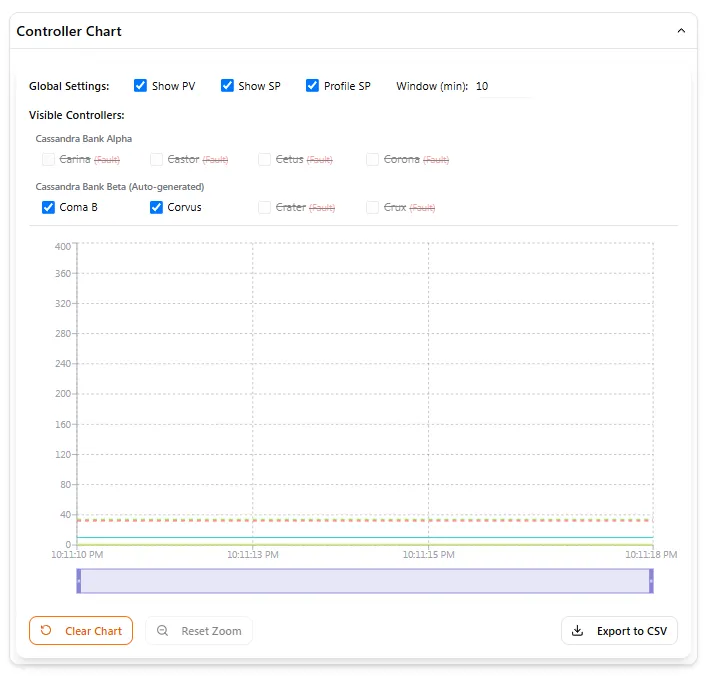
Visible Controllers
This section, often presented in collapsible banks (e.g., “Cassandra Bank Alpha”, “Cassandra Bank Beta (Auto-generated)”), provides a real-time overview and control of individual temperature controllers (PIDs).
Each controller is displayed as a card with the following details and controls:
- Controller Name and ID: Identifies the controller (e.g., “Carina (ID: 10)”).
- Enable/Disable Toggle: A switch to activate or deactivate the controller. If deactivated, it might show a “Stopped” status.
- Alarm Indicator: Highlights if an alarm condition is active for the controller. Active alarms are typically shown with a distinct visual cue (e.g., red border, “Alarm” text).
- Process Value (PV): Displays the current temperature reading from the controller. Error states, such as a thermocouple error, might be shown here (e.g., “T/C Err”).
- Setpoint (SP): Shows the target temperature for the controller. This value can usually be clicked to open an input field, allowing you to manually change the setpoint.
- Output Bar (Optional): Some controllers may have a visual bar indicating the current power output level to the heating element.
This interface allows for quick monitoring of all connected PIDs, their current status, actual temperatures (PV), target temperatures (SP), and provides the ability to enable/disable individual controllers and adjust their setpoints directly.
Temperature Charts
The charts at the bottom of the dashboard visualize the temperature data from the selected controllers. You can configure global settings for these charts, such as toggling the display of Process Value (PV), Setpoint (SP), and the active profile’s actual temperature. You can also set the time window for the displayed data.
2. Profiles
This section is where you manage and configure temperature profiles. Temperature profiles define a sequence of temperature setpoints over time, which the system will attempt to follow.
Temperature Profiles Overview
The main page for Temperature Profiles displays a list of all available profiles. At the top of this page, you have options to:
- Restore Defaults (Local): Resets profiles to their default configurations.
- New Profile (Local): Allows you to create a new temperature profile. There might be a limit on the maximum number of profiles (e.g., “4 max”).
Each profile is presented as a card with the following information and controls:
- Profile Name: The user-defined name of the profile (e.g., “Default Temperature Profile”, “TempProfile_911_Slot_1”).
- Disabled Toggle: A switch to enable or disable the profile.
- Status Information: Displays the total duration (e.g., “00h 00min Total”), current state (e.g., “Idle”), and maximum temperature (e.g., “150°C Max”).
- Source Note: May indicate where the profile data is fetched from (e.g., “Fetched from Modbus service”).
- Associated Controllers: Lists the controllers linked to this profile. It might show details like Group/SlaveID for each controller.
- Miniature Curve: A small graph providing a quick visual representation of the temperature curve defined in the profile.
- Action Buttons:
- Edit (Pencil Icon): Opens the “Edit Temperature Profile” modal for this profile.
- Start (Play Icon): Initiates the execution of this temperature profile.
- Duplicate/Copy (Copy Icon): Creates a copy of this profile.
- Delete (Trash Icon): Removes this profile.
Editing a Temperature Profile
Clicking the Edit button on a profile card or creating a New Profile opens the “Edit Temperature Profile (Local)” modal. This modal allows for detailed configuration:
- Profile Name: A text field at the top to set or change the name of the profile.
- Duration (hh:mm:ss): Input fields to define the total duration of the temperature profile.
- Temperature Curve:
- Max Temperature (°C): Sets the maximum temperature value for the y-axis of the curve editor.
- Curve Editor: A graphical interface where you can define the temperature setpoints over time. You can typically click and drag points to shape the desired temperature ramp and soak periods.
- Clear Curve to Default Ramp: A button to reset the curve to a predefined default ramp.
- Target Controllers (Registers):
- A list of available controllers that can be assigned to this profile. Each controller is listed with its name and addressing information (e.g., “Carina (Slave: 10, SP CMD Addr: 1081)”).
- Checkboxes next to each controller allow you to select which ones will follow this temperature profile.
- Action Buttons (Bottom of Modal):
- Export JSON: Saves the current profile configuration to a JSON file.
- Import JSON: Loads a profile configuration from a JSON file.
Once configured, profiles can be started from the overview page or activated through other system mechanisms, such as the main dashboard.
3. Signal Plots
Signal Plots allow you to control hardware (like relays and outputs) and trigger system actions in synchronization with Temperature Profiles. A Signal Plot is a timeline of “Control Points,” where each point is an action scheduled to occur at a specific time.
The Signal Plot editor allows you to:
- Define a total duration for the sequence, which is often inherited from a parent Temperature Profile.
- Visually add, drag, and edit control points on a timeline.
- Configure each control point’s action, such as writing to a Modbus coil/register or calling a system method.
- Enable or disable entire plots.
- Import and export plot configurations as JSON files for backup and sharing.
Signal plots are essential for creating fully automated processes. For a complete guide on the editor, control point types, and best practices, please see the detailed documentation.
Read the full Signal Plots documentation…